

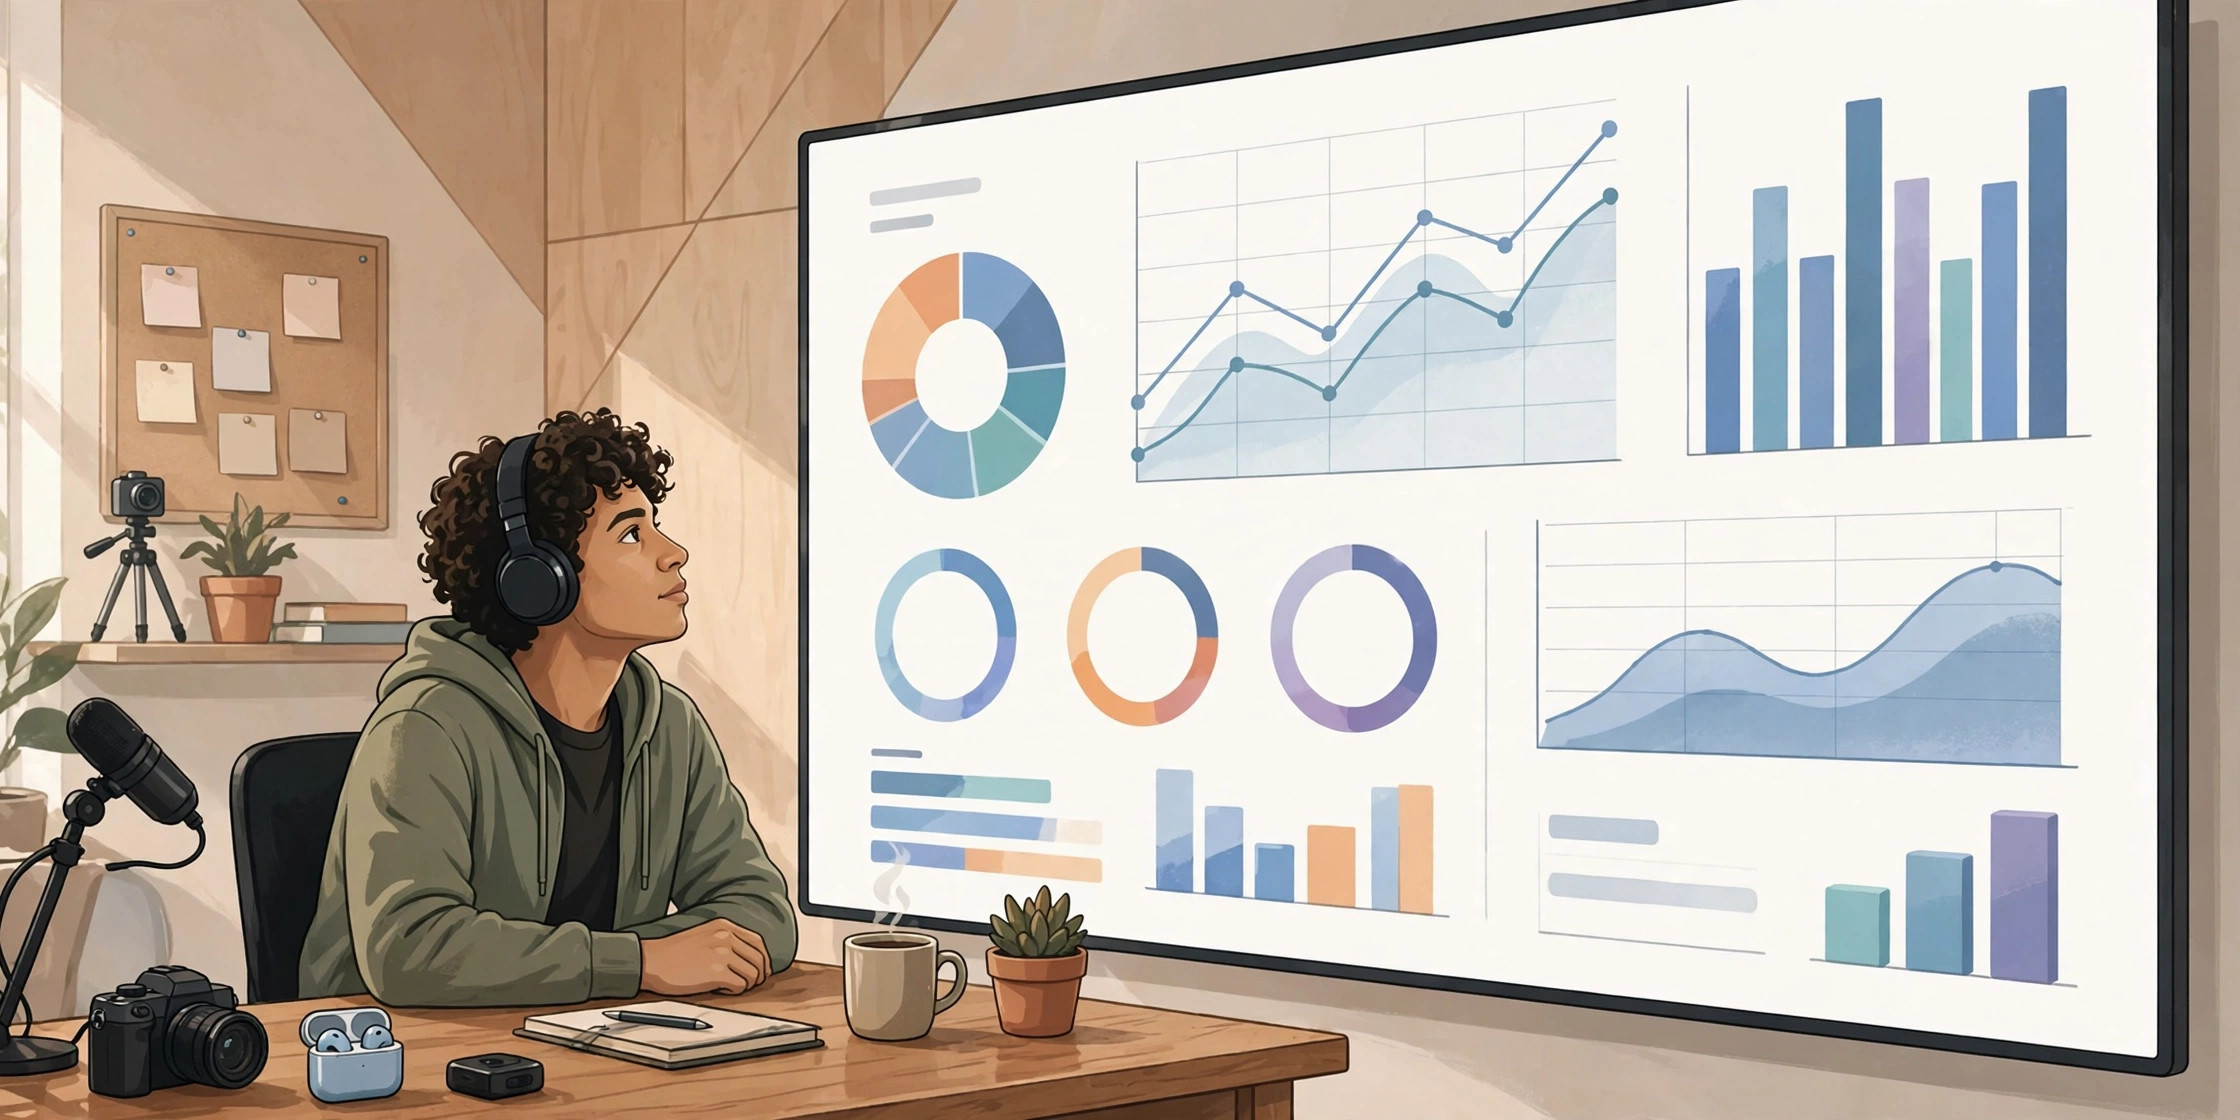
Most creators check their analytics the same way: they open YouTube Studio, glance at the view count, and either feel good or feel discouraged. Then they close the tab. The problem is not the numbers. The problem is that a single number rarely tells you what to do next. Learning how to read YouTube analytics and grow from what you learn means looking past the headline figures and finding the patterns that point to your next decision.
Analytics is not a report card. It is a record of what real viewers did with real videos. When you learn to read it calmly and consistently, it becomes one of the most practical tools you have: it shows which topics pull people in, where viewers lose interest, and which videos bring in subscribers who stay. This guide walks through the metrics that matter, how to interpret them, and how to turn what you see into a simple plan.
Start With a Question, Not a Number
Before you open analytics, decide what you are trying to learn. A useful question sounds like: “Which of my last ten videos kept viewers watching longest?” or “Where do my new subscribers come from?” A vague habit like “checking how I did” usually ends in either relief or worry, and neither one produces a plan.
Pick one question per review session. Look at the reports that answer it, write down what you notice, and choose one action. A weekly review of fifteen focused minutes will teach you more than an hour of scrolling through every chart YouTube Studio offers.
The Metrics That Actually Matter
YouTube Studio offers many numbers. Most of them matter only in context. These are the ones worth understanding first.
Views and Impressions
Views tell you how many times people watched. Impressions tell you how often YouTube showed your thumbnail and title to someone. Together, they tell a story: a video with many impressions but few views may have a thumbnail or title that is not earning the click. A video with few impressions may need a stronger topic, a clearer title, or more time before you judge it.
Click-Through Rate
Click-through rate is the share of impressions that turned into views. It is best read as a signal about packaging — your title, thumbnail, and topic — rather than about the video itself. If a video has a low click-through rate, the first thing to test is the packaging, not the content. Try a clearer title or a thumbnail that shows the payoff of the video more directly.
Average View Duration and Audience Retention
Average view duration tells you how long the typical viewer stayed. The retention graph shows where viewers kept watching and where they left. This is where analytics gets genuinely useful. A sharp drop in the first thirty seconds usually means the opening did not match the promise of the title. A gradual decline through the middle often means the video repeated itself or wandered. A rise near the end may show that viewers skipped ahead to a specific section — useful information for your next video on that topic.
Watch Time
Watch time combines views with how long people stayed. It is a helpful overall measure of how much viewing your channel earns, but it is not a target you can improve directly. You improve watch time by improving the things that feed it: topics people want, openings that hold attention, and videos structured so viewers know what comes next.
Subscribers Gained and Lost
Subscriber change per video shows which videos convert viewers into subscribers. Pay special attention to videos that gain subscribers at a higher rate than your average. They usually share something — a topic, a format, a style of opening — that you can repeat deliberately. A video that loses subscribers is not a disaster, but if several videos on one topic lose subscribers, that topic may not be right for your audience.
Traffic Sources
Traffic sources show where viewers found your video: search, suggested videos, browse features, external sites, and more. This matters because different sources reward different strengths. Search traffic rewards clear topics and titles that match what people look for. Suggested traffic rewards videos that keep viewers watching after another video. When you know where your views come from, you can shape your next videos to fit the source that is already working for you.
How to Read the Retention Graph Like an Editor
The retention graph is the closest thing analytics gives you to watching over your viewers’ shoulders. Read it in three passes.
- The opening. Look at the first thirty seconds. A steep early drop is the most common pattern on YouTube, and it usually means the intro was too long, too vague, or too different from the title’s promise. Tighten the opening: state the payoff quickly, then deliver it.
- The middle. Look for the spots where the line slides downward for a long stretch. Those are the sections where viewers decided the video was no longer worth their time. When you find one, rewatch that section of your video and ask what a viewer was waiting for. Often the fix is simple: cut repetition, show the example sooner, or split the section into a separate video.
- The ending. Look at the final minute. If most viewers leave before the last call to action, move your most important message earlier. End screens and subscription reminders only work if viewers are still there to see them.
Compare the graphs of your best and weakest videos side by side. The differences are usually visible within seconds, and they are more honest than your memory of how the recording went.
Turn Observations Into One Clear Action
Analytics only helps if it changes what you make next. After each review, write one sentence that starts with “Next time, I will…” and keep it concrete. Examples that work: “Next time, I will open with the result before explaining the steps.” “Next time, I will make the thumbnail show the finished outcome.” “Next time, I will publish a follow-up to the video that gained the most subscribers.”
One action per video is enough. If you try to fix five things at once, you will not know which change made the difference. Small, deliberate experiments — one variable at a time — are how a channel improves steadily instead of guessing.
Common Analytics Mistakes to Avoid
- Judging a video too early. A video needs time to gather data. Checking every hour in the first day mostly produces stress. Give a video at least a few days, and compare videos of a similar age.
- Comparing unlike videos. A Short and a long tutorial will have very different retention patterns. Compare Shorts with Shorts and long videos with long videos, and compare videos on similar topics.
- Chasing a single metric. A high click-through rate with poor retention means the packaging promised more than the video delivered. A great retention rate with few impressions means the video may need better packaging. Read metrics together, not alone.
- Copying another channel’s numbers. Benchmarks from other creators can be interesting, but your audience, topic, and format set your baseline. The comparison that matters is your channel against its own past performance.
- Ignoring the videos that quietly perform. A video with modest views but steady search traffic and strong retention may be your most useful video over time. Look for these slow, steady performers — they often reveal topics worth revisiting.
FAQ
How often should I check YouTube Analytics?
A focused weekly review is enough for most creators. Check more often only when you are running a deliberate test, such as comparing two thumbnails, and even then, wait until each version has gathered enough views to compare fairly.
Which metric matters most for a small channel?
There is no single metric that decides growth. For small channels, the most useful combination is usually retention plus subscribers gained per video. Retention shows whether people stay, and subscriber gains show whether they want more.
Why did my views drop if I did not change anything?
View counts move for many reasons: seasonality, topic interest, competition for the same audience, and how YouTube distributes videos over time. A single drop rarely has one cause. Look at several videos and several weeks before concluding that something is wrong.
Should I delete videos that perform poorly?
Usually not. A low-performing video can still bring in search traffic, teach you something, or find an audience later. Consider improving its title, thumbnail, or description first. Removal is a last resort for videos that are outdated, misleading, or no longer represent your channel.
Can analytics tell me what video to make next?
Analytics can point you toward strong topics, formats, and openings, but it cannot replace your judgment. Use it to confirm or challenge your ideas, then choose the next video based on what your audience responds to and what you can make well.
What to Do Next
Open YouTube Studio this week and run one focused review. Pick your last ten videos, compare their retention graphs and subscribers gained, and write down one pattern you notice and one action you will take. Then make your next video with that action in mind — a tighter opening, a clearer thumbnail, or a follow-up to your strongest topic.
Growth on YouTube is rarely one dramatic breakthrough. It is a series of small, informed adjustments, repeated over months. Analytics is how you make those adjustments informed instead of random.
Want more guidance on growing your channel? Explore our YouTube services, browse more guides in our YouTube articles, see everything we offer on our services page, or contact us to talk about your channel.